PowerAppsChartComponents
yaml for Power App chart components
Currently supported are Pie charts (with some functionality towards gauge charts) and Bar charts (some support for grouped as stack, multi-column, and stacked with optional line segments). Each draws the graph itself using SVG image (svg source of image available as property) with button overlay for interactivity including selecting slices and hover tooltips. The pie is split into the pie chart and a legend. The Legend output property of the pie can be used as the input Legend property for the legend component. The bar chart still needs some work for its interactivity but supports multiple variations. The interactive layer hides during printing so a clean chart is drawn for printing (such as saving to a pdf). The graphs also support being printed to PDF using experimental PDF() function, but slow to generate PDF and result is fuzzy - better to Print() to pdf. A sample screen is also provided showing both graphs. See example: 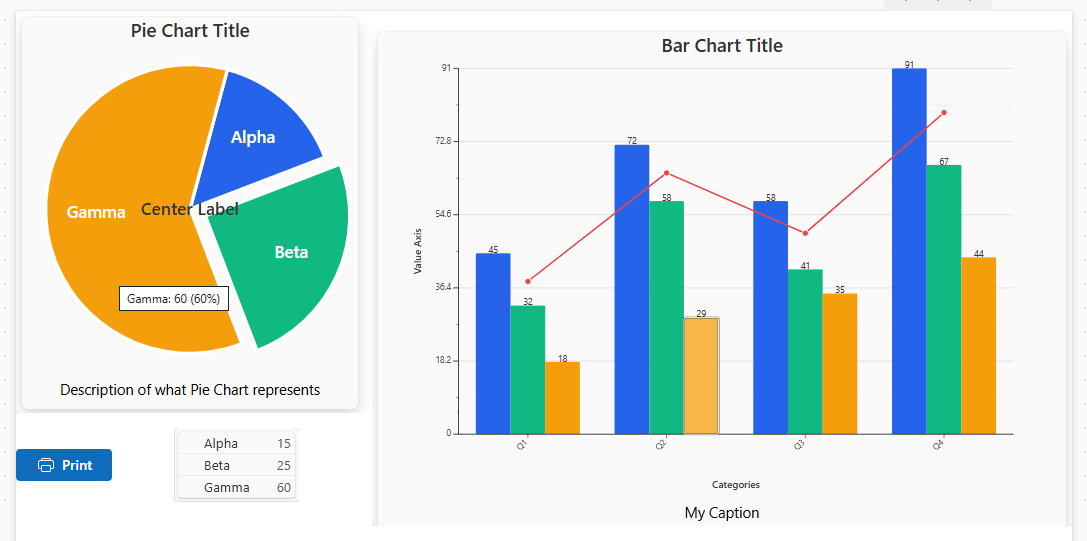 The file visual_explanation.html provides an overview of how the pie chart buttons map to slices. Note that the components compute the graphs in OnReset property so do not display in component editor by default. Add a temp button that simply calls Reset(cmpChart); in its OnSelect() and click the button – it can then be removed (or hidden). In actual usage this is not needed as changing the input triggers a reset and if the input is static there is also a timer that fires once to ensure reset is done. To use, download the yaml source files, copy all, then go to Power Apps, Components tab, if no components exist create a component (delete it after next step) so can select Paste option and past the source. This is the source as shown from View Source option. Note: some adjustments may be necessary depending on what is available in your specific instance, though this is unlikely unless you have too old or too new of the controls. No premium features are used. These are interactive versions of the charts and print well; however, if the standard charts work for you then use them instead. Some tweaking may be needed depending on your data. Released as public domain, however, if you can not use that because of legal reasons, then they may be used under CC0 or MIT/BSD license. Use at your own risk, do not use where not legally able to use or disclaimer of responsibility not valid.